- Stay Connected

Socialize

 Abraham Lincoln
If given the truth, the people can be depended upon to meet any national crisis...
Abraham Lincoln
If given the truth, the people can be depended upon to meet any national crisis...

 Guildford news...
for Guildford people, brought to you by Guildford reporters - Guildford's own news service
Guildford news...
for Guildford people, brought to you by Guildford reporters - Guildford's own news service
Letter: Lib Dem Bar Charts Are Misleading
Published on: 5 Jun, 2017
Updated on: 5 Jun, 2017
Two letters received from members of Guildford Labour cover the same subject: “misleading” Lib Dem bar charts in their election material, a claim rejected by the Lib Dems.
 From Angela Gunning
Labour borough councillor for Stoke
Once again there are Lib Dem election leaflets in circulation with very misleading “facts” about how Guildford has voted in the past. As usual, the stats do not compare like-with-like.
Results for Guildford Borough elections are quoted in the ridiculous and misleading bar charts; however importantly – the borough covers parts of four constituencies (Surrey Heath, Woking, Mole Valley and Guildford).
Furthermore, Guildford parliamentary constituency extends south right to the Sussex border and includes all Cranleigh, Ewhurst and Alfold. And, as we know, these villages are in Waverley Borough. So one might well ask why aren’t Waverley Borough results quoted? (Anyone unsure should look at Ordnance Survey maps online for constituency and borough boundaries].
Only 26 out of 48 Guildford Borough councillors represent wards that are in the Guildford parliamentary constituency, but enough of playing games with past results – let’s have the facts. In the 2015 General Election it was: Conservatives 57%; Lib Dems 15%; Labour 13%; Others 15%.
Vote for what you believe in; no vote is ever wasted.
From Brian Creese
Guildford Labour communications
I think what really winds up Labour Party supporters is the Lib Dems use of fabricated graphics.
For the past few years I have given a lecture at the Institute of Education on misleading use of graphical data, and Lib Dem leaflets fall guilty of all of the usual tricks of the trade – selecting dubious sources for data, selecting ranges to tell a specific story, distorting axes and sizing bars on bar charts to give a misleading impression.
This is not a criticism of Guildford Lib Dems only; we assume it is national policy as the same things can be seen from their candidates all over the country.
So let us be absolutely clear on two things. At the last general election, Labour was third in Guildford with 13% of the vote. The Lib Dems had 15%. Add them together and we get…. that will be 28% of the vote. Enough to defeat the Tories? Not even close.
Both Labour and the Lib Dems need to use this election to raise their own support as there is absolutely no point tactical voting in Guildford.
Response from Sue Doughty
Former Lib Dem MP for Guildford and Lib Dems communications
The Guildford Labour party appears to have borrowed Diane Abbott’s calculator!
We are completely comfortable with the veracity of the statistics we use, and suggest that Angela Gunning and Brian Creese re-check their arithmetic. If either have a problem with these statistics, we suggest their time would be best spent working on some decent policies for Labour, rather than quibbling over election history.
When it came to real votes cast in Guildford and Cranleigh last month, 32% voted Liberal Democrat and a vote for Zöe Franklin is the only way to defeat the Conservatives and make sure we have an MP who’ll stand up for local people on the real issues that matter – like protecting schools from cuts and properly investing in the NHS.
Full list of all candidates standing in the general election in Guildford:

Share This Post


Responses to Letter: Lib Dem Bar Charts Are Misleading
Leave a Comment Please see our comments policy. All comments are moderated and may take time to appear. Full names, or at least initial and surname, must be given.

I'm living well for nothing at all! (See: No Trifling Matter: Magpie Trapped in Godalming Sainsbury’s)


Next stop, Debt Chasm! (See: We Should All Be Outraged About the Failure to Deal with Legacy Debt)


Adam Clixby
June 5, 2017 at 5:39 pm
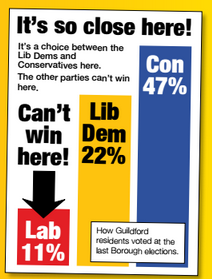
A disappointing response from Sue Doughty, as the bar chart shown is clearly misleading. The Lib Dem bar should be less than half the height of the Conservative bar.
Shelley Grainger
June 5, 2017 at 10:55 pm
Sue Doughty is comparing Surrey County Council votes with what might happen in the general election. The last one of those was only two years ago, why not look at those figures? Then Labour got 13% and the Lib Dems got 15%. Even the Progressive Alliance website says that people in this constituency should vote for whatever party they want and campaign in a marginal. They do not advocate tactical voting here. And they are the expert!
Also, there is no arguing that the bar-chart pictured is laughable. A six-year-old can spot that it misrepresents the numbers written on it. Time to ditch the bar charts, I think.
David Burgess
June 5, 2017 at 11:32 pm
Sue Doughty should look at the graph and observe the difference in heights between each bar compared to the difference in percentages. She criticises a Labour MP but fails to see the utter error in the graph and how can she justify leapfrogging over the last general election result in order to misrepresent an election with different boundaries and a lower turnout, just because it suits her case?
If she is telling Angela Gunning and Brian Creese to recheck their arithmetic, wouldn’t it be reasonable to tell us precisely where you might believe their arithmetic to actually be wrong?
David Burgess is a doctor of mathematics
Brian Creese
June 6, 2017 at 9:12 am
There is definitely no need to do any rethinking on our part. Everyone reading this strand will understand that the only event with any direct relevance to Thursday’s general election vote is the previous general election in Guildford & Cranleigh, held in 2015. The result then was not good for either of our parties.
Most will be puzzled by your selecting data from the last borough elections to put on the Lib Dem leaflets since, as Angela Gunning has pointed out, the areas they cover are different from the parliamentary constituency and, as we all know, people vote differently in local elections and parliamentary ones. And when the Lib Dem graphs are drawn from these figures (which have no bearing on how the people of Guildford might vote on Thursday) they distort the axes to give a misleading impression.
As I mentioned previously, this does seem to be a national tactic from the Lib Dems. There is even a compilation of dubious Lib Dem charts on BuzzFeed – well worth a laugh.
Brian Creese is handling communications for Guildford Labour
Brian Creese
June 6, 2017 at 5:05 pm
Unfortunately the charts did not appear in my reply above. You can find them on my Facebook page – though easily created yourselves on an Excel page… You will see they look nothing like the Lib Dem leaflets.
George Potter
June 6, 2017 at 7:11 pm
In the general election in 2015 the Liberal Democrats got 15% and Labour got 13%.
But in the local elections last month, across the constituency, the Liberal Democrats got 32% and Labour got 11%.
Clearly there has been a big shift in public opinion in Guildford and Cranleigh since 2015 and the Labour party are kidding themselves if they’re pretending there hasn’t been.
And they don’t have to take my word for it either; all they need to do is wait 48 hours for the general election results which I’m sure will be pretty similar to the local election results last month.
Ben Paton
June 7, 2017 at 5:55 am
Well done Angela Gunning, one of the saner voices in Guildford Borough Council. Nonsense should be exposed.
She makes a wise comment: “Vote for what you believe in; no vote is ever wasted.”
I’d just add, be careful what you believe!